No aqueous crystal violet? No problem!
Prepare your students for their chemistry exams with science they can see! Join Vernier chemistry expert Nüsret Hisim as he shows you how to use two common household items, food coloring and bleach, to explore the kinetics of a chemical reaction. Walk away with strategies for teaching this important scientific concept, including using calculated columns to determine the order of reaction and the rate expression.
You will have the opportunity to
- Observe and graph the rate of reaction between bleach and food coloring.
- Learn exam-review strategies from an experienced AP reader.
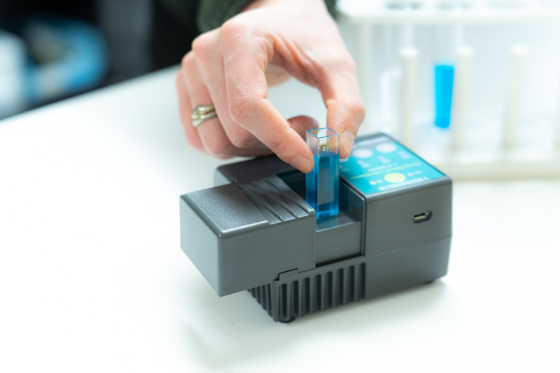
- Gain hands-on experience using the data-sharing feature of the Vernier Graphical Analysis® Pro app, as well as a Go Direct® Colorimeter, to review the basic principles of kinetics.
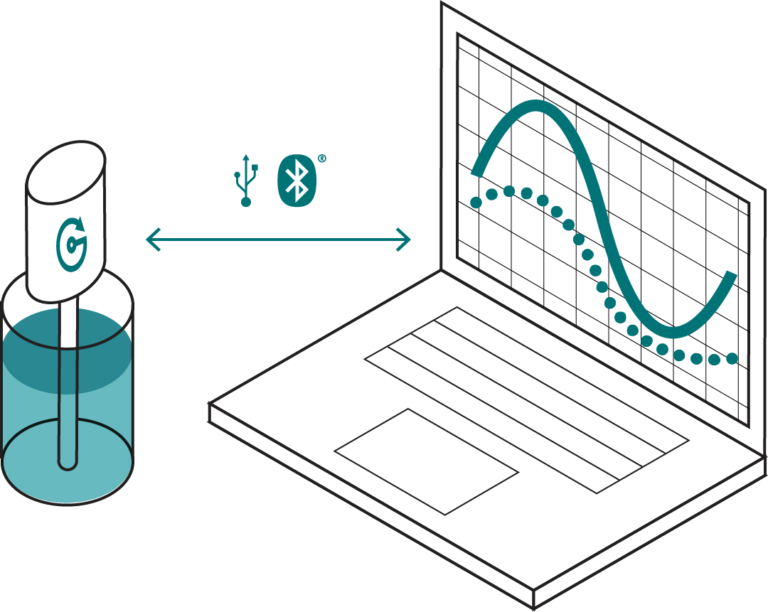
We'll be using the data-sharing capability in Graphical Analysis Pro to send sensor data to all Pro users so you can follow along as we analyze the data. Don't have Graphical Analysis Pro?
Sign up for a free trial before the webinar.
Get ready to amaze your students with this reaction transformation!
Featured Products
Vernier Graphical Analysis: With the Graphical Analysis app, students can visualize and interact with experiment data collected via nearly any Vernier sensor. With Graphical Analysis Pro, educators can unlock advanced analysis capabilities, access additional graph types (e.g., FFTs), facilitate remote and asynchronous learning, and provide opportunities to reinforce and extend learning.
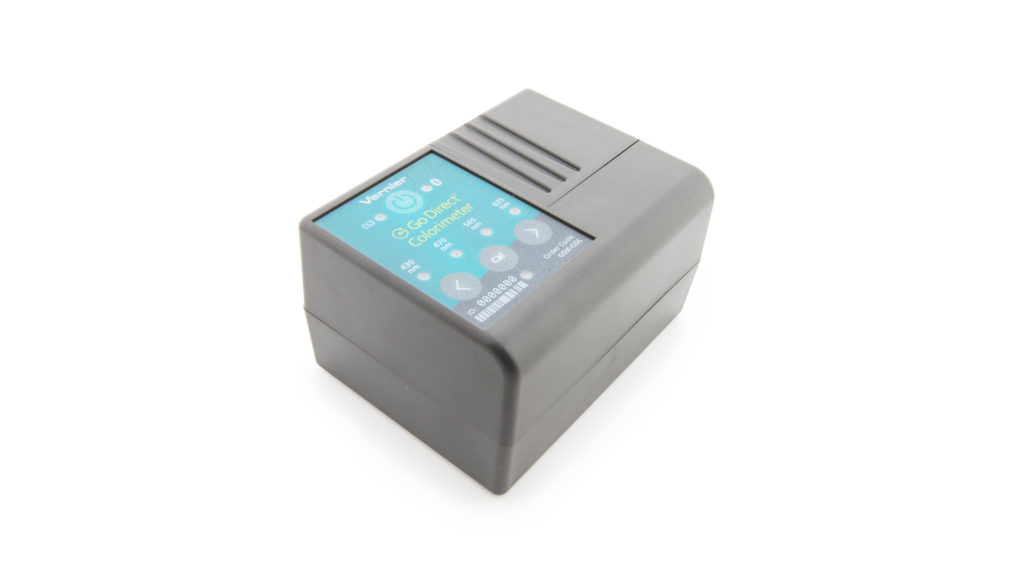
Go Direct Colorimeter: Use this affordable sensor to explore absorbance and percent transmittance in a variety of experiments, including Beer’s law and equilibrium (absorbance vs. concentration), and kinetic studies (concentration vs. time). Students select among four wavelengths (430 nm, 470 nm, 565 nm, and 635 nm) to set up their experiment.
Presenters
Nüsret Hisim
Chemistry Educational Technology Specialist
Melissa Hill, PhD
Chemistry Staff Specialist
©2024 Vernier Science Education
vernier.com


