
Exploring Biomedical Science with Vernier and Project Lead the Way
DATE
Wednesday, June 21
TIME
2:00–2:45 p.m. PDT
5:00–5:45 p.m. EDT
Biology

Get ready to engage your students with hands-on,
real-world learning experiences!
Get ready to engage your students with hands-on, real-world learning experiences in biomedical science and human physiology! Join Vernier Director of Biology John Melville as he provides teaching tips and answers educators’ top questions about the human physiology sensors used in the biomedical science curriculum from Project Lead the Way (PLTW).
Attendees will
- Learn how to effectively guide students through the process of data collection and analysis as they explore biomedical science.
- Learn how to easily record EMGs, EKGs, and other important biomedical signals from a variety of sensors.
- Gain hands-on experience using the Go Direct® Hand Dynamometer, the Go Direct EKG Sensor, and our Vernier Graphical Analysis® Pro app.
- Learn how to use Graphical Analysis Pro to make older sensors (e.g., the EKG Sensor and Hand Dynamometer) work like newer Go Direct sensors.
This webinar is for educators who are experienced with our sensors, as well as those just getting started. Join us to get your top questions answered—and to find out how you can get to the heart of biomedical science with Vernier and PLTW!
Featured Products
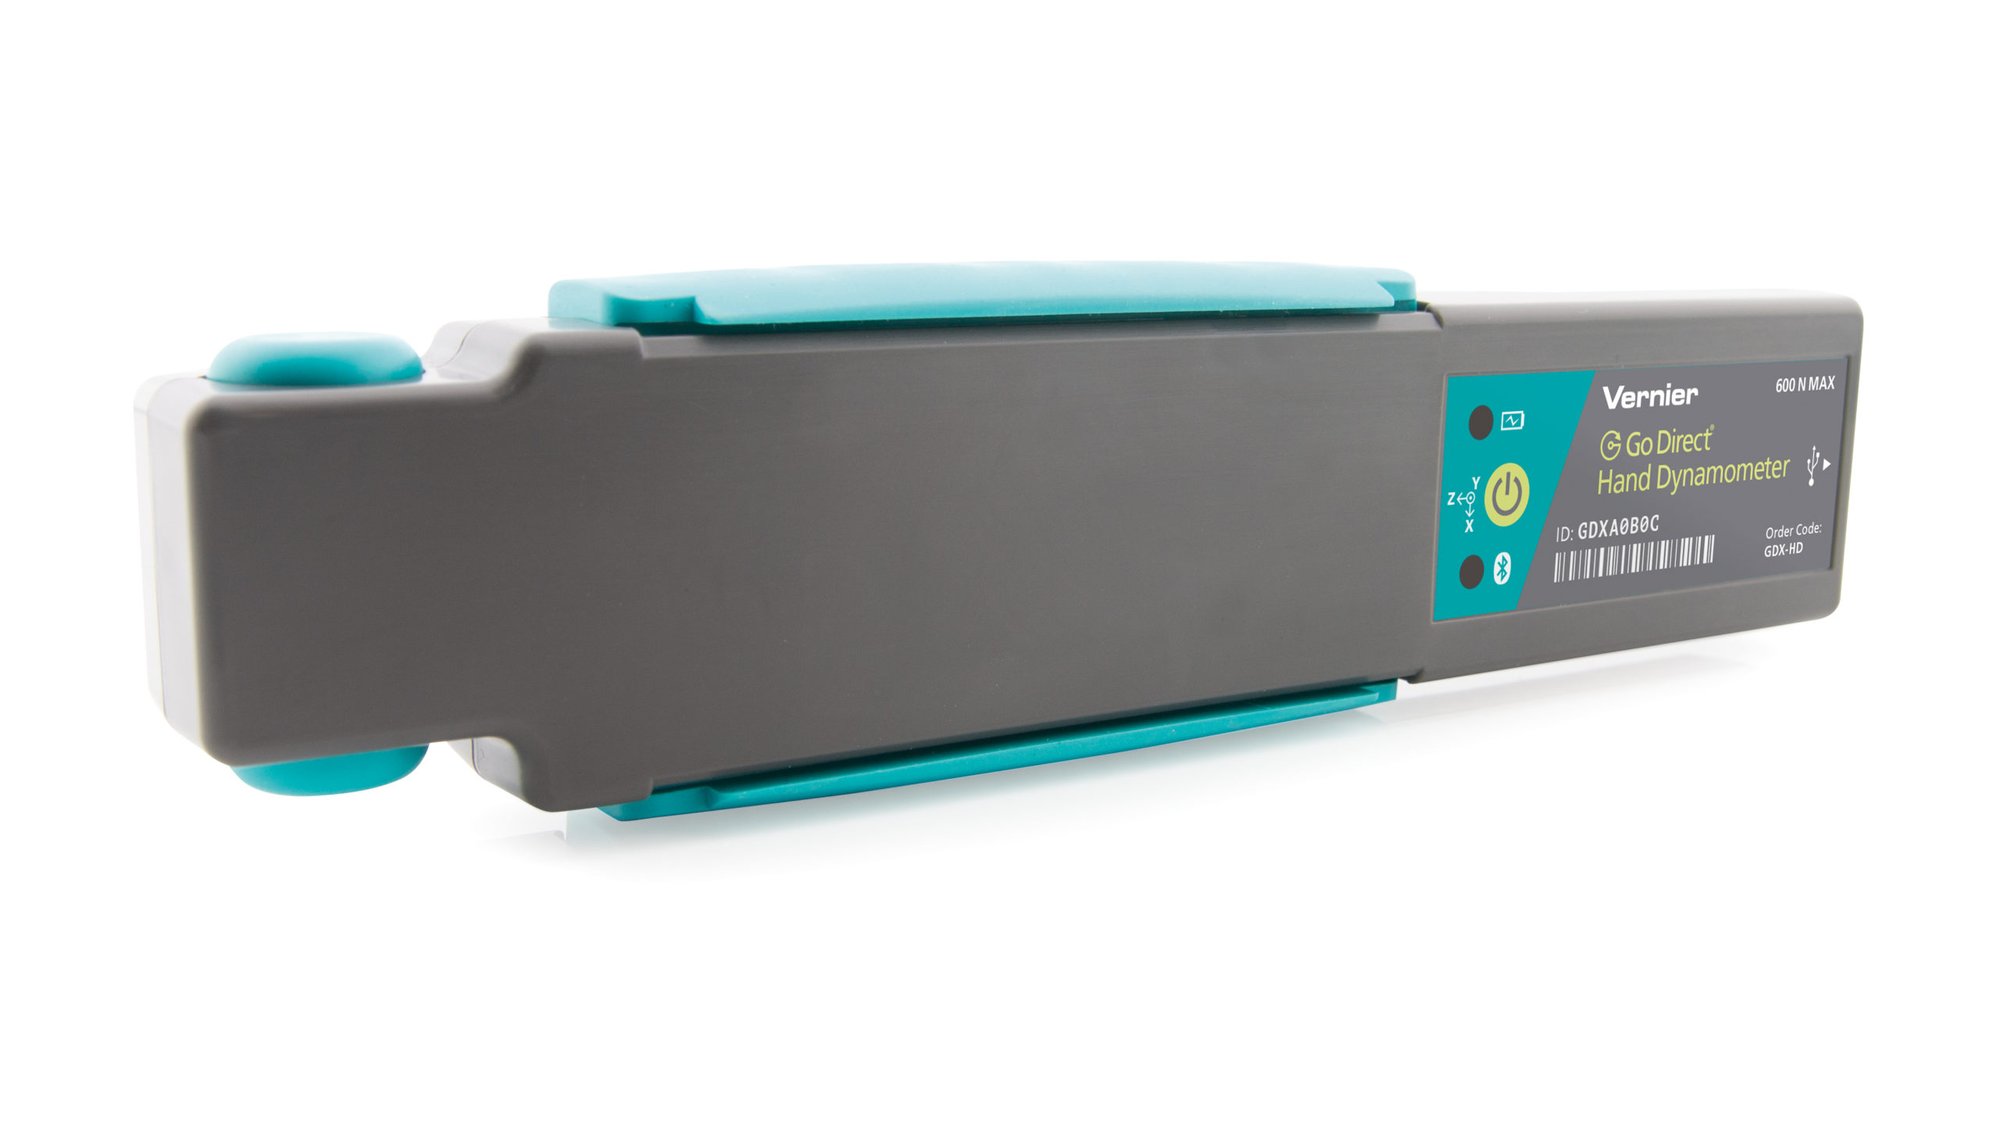
Go Direct Hand Dynamometer: The Go Direct Hand Dynamometer wirelessly measures grip strength, pinch strength, and muscle fatigue.

Go Direct EKG Sensor: The Go Direct EKG Sensor records electrical signals produced during heart or muscle contractions. It connects via USB or Bluetooth® wireless technology to your device.

LabQuest Mini: LabQuest Mini is a powerful, affordable, and easy-to-use sensor interface for data collection on a computer or Chromebook™.

Vernier Graphical Analysis Pro: With the Graphical Analysis app, students can visualize and interact with experiment data collected via nearly any Vernier sensor. With Graphical Analysis Pro, you can enrich live instruction while providing more opportunities for students to interact with and analyze data outside of class time.
Presenters

John Melville, PhD
Director of Biology
©2024 Vernier Science Education
vernier.com